I'mInsightly,happy to help you find the insights you’re looking for!
You work at INS Cycles, a company that manufactures and sells bicycles and accessories. As a business user, you are seeking insights across key functions—including sales, production, purchasing, HR, finance, inventory, and CRM.
What insights would you like to know today?
Not Sure?
Alright, Let’s warm up before we play. Take a look at what Mercy, Alexander, Victor, and Margot have asked for.
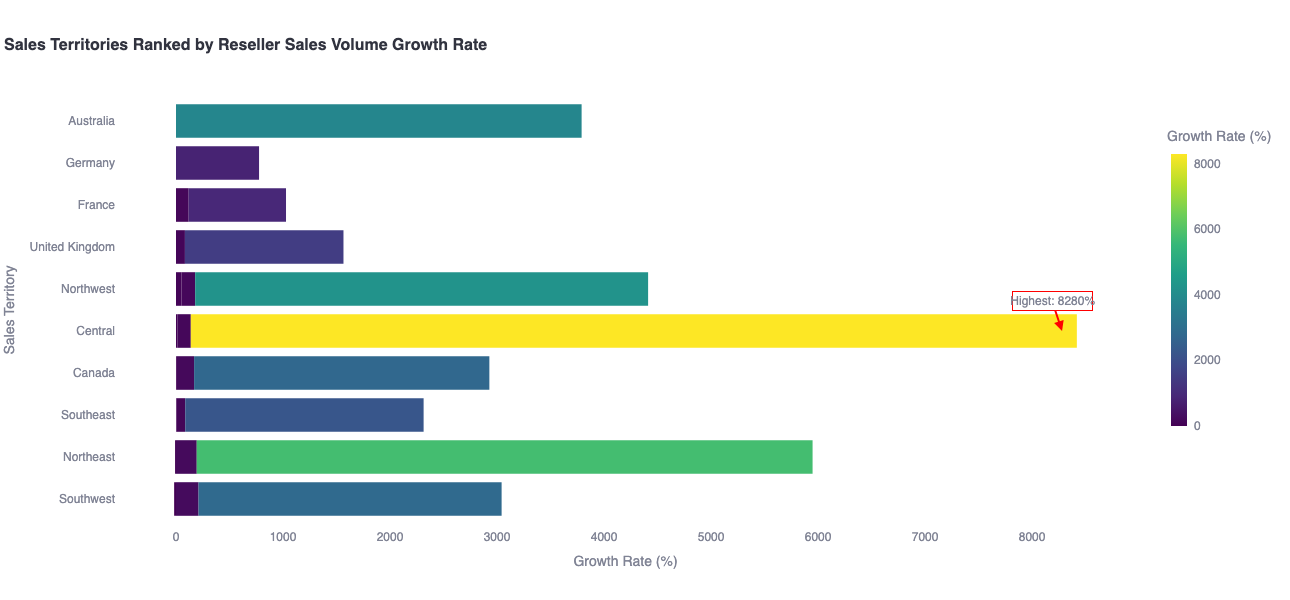
Which sales territories have seen the highest growth in reseller sales volume compared to the previous year?
Key Insights:
- 2011 was a breakthrough year for US domestic markets, with Central, Northeast, and Northwest territories experiencing explosive growth rates of over 4,000%, indicating these regions successfully transitioned from minimal reseller presence to substantial sales operations
- Growth momentum naturally slowed but remained strong through 2012-2013, as territories matured from their initial explosive phase into more sustainable double and triple-digit growth rates, suggesting the business model gained solid traction across markets
- Some high-performing territories hit growth plateaus by 2013, with Northeast and Southwest actually declining 9% and 17% respectively, signaling these markets may be reaching saturation and require new strategies to reignite growth
| # | Sales Territory / Region | Calendar Year | Total Volume | Previous Year Volume | Growth Rate |
|---|---|---|---|---|---|
| 1 | Central | 2011 | 3352 | 40 | 8280 |
| 2 | Northeast | 2011 | 2986 | 51 | 5754.901960784313 |
| 3 | Northwest | 2011 | 4116 | 95 | 4232.631578947368 |
| 4 | Australia | 2013 | 4824 | 124 | 3790.322580645161 |
| 5 | Southwest | 2011 | 6978 | 238 | 2831.932773109243 |
| 6 | Canada | 2011 | 6462 | 226 | 2759.29203539823 |
| 7 | Southeast | 2011 | 3957 | 170 | 2227.647058823529 |
| 8 | United Kingdom | 2012 | 4555 | 288 | 1481.597222222222 |
| 9 | France | 2012 | 4372 | 433 | 909.699769053117 |
| 10 | Germany | 2013 | 6624 | 756 | 776.190476190476 |
| 11 | Southwest | 2012 | 21690 | 6978 | 210.834049871023 |
| 12 | Northeast | 2012 | 8772 | 2986 | 193.770931011386 |
| 13 | Canada | 2012 | 16877 | 6462 | 161.173011451562 |
| 14 | Northwest | 2012 | 9396 | 4116 | 128.279883381924 |
| 15 | Central | 2012 | 7560 | 3352 | 125.536992840095 |
| 16 | France | 2013 | 9543 | 4372 | 118.27538883806 |
| 17 | United Kingdom | 2013 | 8350 | 4555 | 83.315038419319 |
| 18 | Southeast | 2012 | 7226 | 3957 | 82.613090725296 |
| 19 | Northwest | 2013 | 14176 | 9396 | 50.872711792252 |
| 20 | Central | 2013 | 8521 | 7560 | 12.71164021164 |
| 21 | Canada | 2013 | 18196 | 16877 | 7.815370030218 |
| 22 | Southeast | 2013 | 7483 | 7226 | 3.556601162468 |
| 23 | Northeast | 2013 | 8007 | 8772 | -8.720930232558 |
| 24 | Southwest | 2013 | 17934 | 21690 | -17.316735822959 |
SELECT pc.EnglishProductCategoryName, d.CalendarYear, SUM(fis.SalesAmount) AS TotalSalesRevenue
FROM [dbo].[FactInternetSales] fis
JOIN [dbo].[DimProduct] p ON fis.ProductKey = p.ProductKey
JOIN [dbo].[DimProductSubcategory] ps ON p.ProductSubcategoryKey = ps.ProductSubcategoryKey
JOIN [dbo].[DimProductCategory] pc ON ps.ProductCategoryKey = pc.ProductCategoryKey
JOIN [dbo].[DimDate] d ON fis.OrderDateKey = d.DateKey
GROUP BY pc.EnglishProductCategoryName, d.CalendarYear
ORDER BY pc.EnglishProductCategoryName, d.CalendarYear;
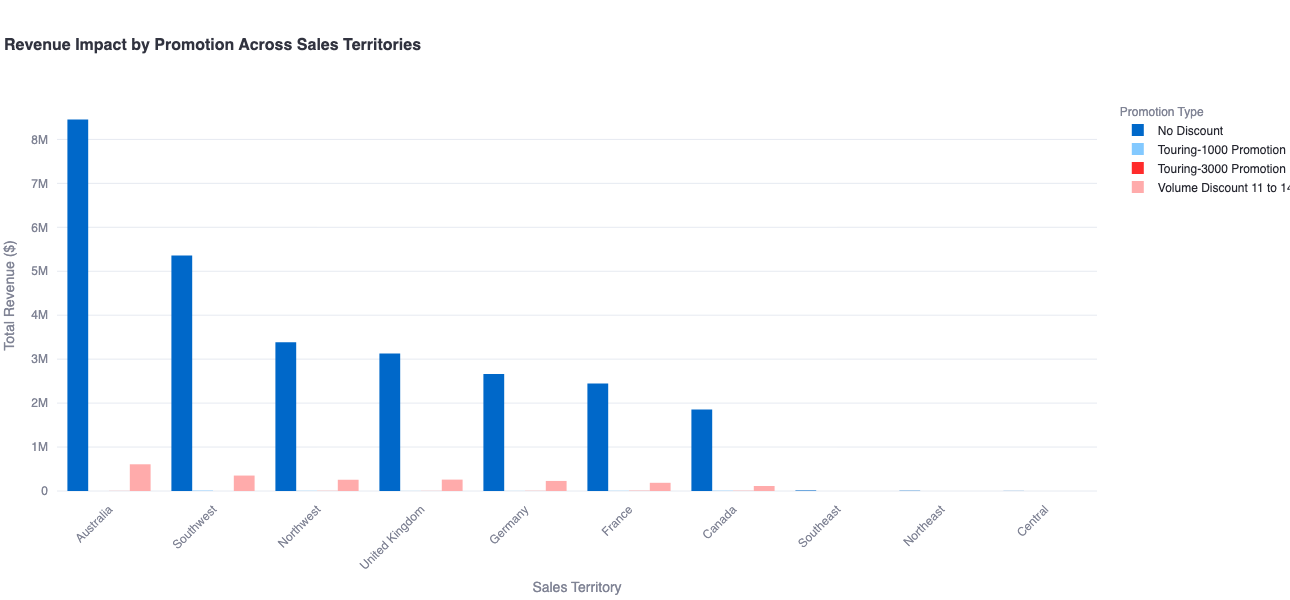
How did each promotion impact revenue in different sales territories?
Key Insights:
- Australia dominates revenue generation across all promotion strategies, leading with 8.5 Minnon − promotional sales and 608K in volume discount sales, suggesting this market has the strongest customer base and should be prioritized for future promotional investments
- Volume discounts significantly outperform product-specific promotions, generating hundreds of thousands in revenue compared to touring promotions that only yield thousands, indicating customers respond much better to broad discount offers than targeted product campaigns
- US domestic markets (Central, Northeast, Southeast) show extremely weak promotional performance with revenue in the low thousands or even single digits, revealing a major opportunity gap that requires immediate attention to understand why these regions aren't responding to promotional efforts
| # | EnglishPromotionName | SalesTerritoryRegion | TotalRevenue |
|---|---|---|---|
| 1 | No Discount | Australia | 8451842.8894 |
| 2 | No Discount | Southwest | 5356519.7734 |
| 3 | No Discount | Northwest | 3386945.8844 |
| 4 | No Discount | United Kingdom | 3128500.6877 |
| 5 | No Discount | Germany | 2660485.3742 |
| 6 | No Discount | France | 2448737.1413 |
| 7 | No Discount | Canada | 1853350.0447 |
| 8 | No Discount | Southeast | 12236.5596 |
| 9 | No Discount | Northeast | 6530.1782 |
| 10 | No Discount | Central | 2458.5496 |
| 11 | Touring-1000 Promotion | Southwest | 9536.28 |
| 12 | Touring-1000 Promotion | Canada | 7152.21 |
| 13 | Touring-1000 Promotion | France | 4768.14 |
| 14 | Touring-1000 Promotion | Northwest | 4768.14 |
| 15 | Touring-1000 Promotion | United Kingdom | 2384.07 |
| 16 | Touring-1000 Promotion | Germany | 2384.07 |
| 17 | Touring-3000 Promotion | France | 3711.75 |
| 18 | Touring-3000 Promotion | Canada | 2969.4 |
| 19 | Touring-3000 Promotion | Germany | 2227.05 |
| 20 | Touring-3000 Promotion | Northwest | 2227.05 |
| 21 | Touring-3000 Promotion | United Kingdom | 1484.7 |
| 22 | Touring-3000 Promotion | Australia | 1484.7 |
| 23 | Touring-3000 Promotion | Southwest | 742.35 |
| 24 | Volume Discount 11 to 14 | Australia | 607672.995 |
| 25 | Volume Discount 11 to 14 | Southwest | 351352.4088 |
| 26 | Volume Discount 11 to 14 | United Kingdom | 259342.7532 |
| 27 | Volume Discount 11 to 14 | Northwest | 255925.4768 |
| 28 | Volume Discount 11 to 14 | Germany | 229215.844 |
| 29 | Volume Discount 11 to 14 | France | 186800.683 |
| 30 | Volume Discount 11 to 14 | Canada | 607672.995 |
| 31 | Volume Discount 11 to 14 | Central | 542.28 |
| 32 | Volume Discount 11 to 14 | Northeast | 2.29 |
| 33 | Volume Discount 11 to 14 | Southeast | 2.29 |
SELECT p.EnglishPromotionName,
st.SalesTerritoryRegion,
SUM(fis.SalesAmount) AS TotalRevenue
FROM [dbo].[FactInternetSales] fis
JOIN [dbo].[DimPromotion] p ON fis.PromotionKey = p.PromotionKey
JOIN [dbo].[DimSalesTerritory] st ON fis.SalesTerritoryKey = st.SalesTerritoryKey
GROUP BY p.EnglishPromotionName, st.SalesTerritoryRegion
ORDER BY p.EnglishPromotionName, TotalRevenue DESC;
Victor Pierce
Procurement Manager
Goal: Maximize territory revenue and sales performance
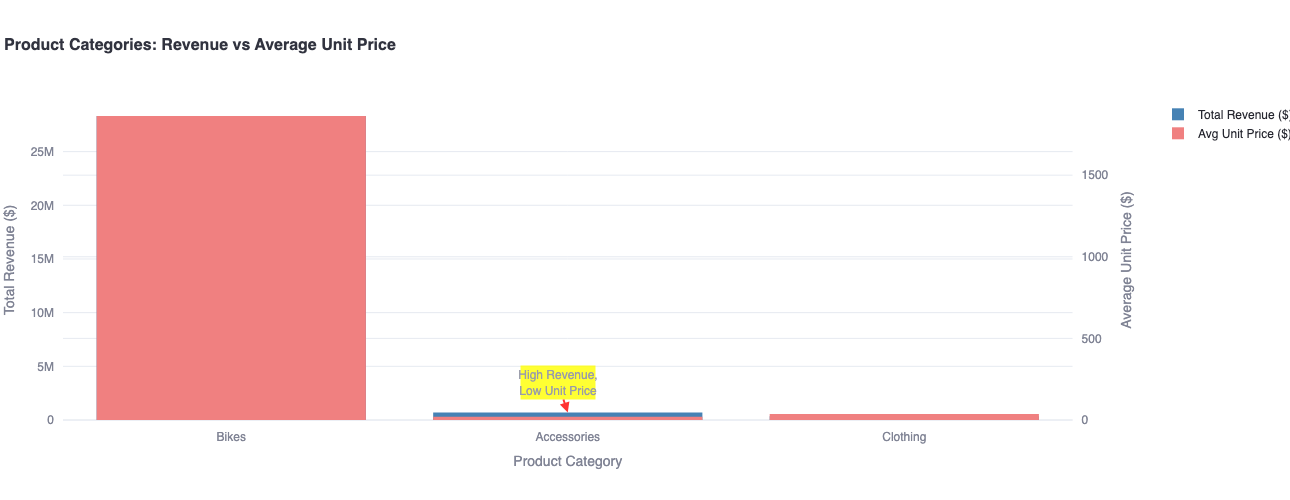
Which product categories generate high sales revenue but have relatively low average unit prices?
Key Insights:
- Accessories represent a high-volume, low-margin goldmine - Despite having the lowest average unit price at just 19 ,accessories still generate substantialre venue of 19, accessories stillgenerate substantial revenue of 700K, indicating extremely high sales volumes and suggesting strong customer demand for complementary products
- Bikes dominate through premium pricing strategy - While bikes have the highest average unit price at 1,862, they generate the vast majority of total venue ( 1,862, they generate the vast majority of total revenue(28.3M), demonstrating that customers are willing to pay premium prices for core products, making this the most profitable category per unit sold
- Clothing sits in the middle ground with untapped potential - With moderate unit prices around 37 and the lowest totale venue at 37 and the lowest total revenue at 340K, clothing appears to be underperforming relative to accessories, suggesting an opportunity to either increase volume through better marketing or raise prices to improve profitability per item
| # | EnglishProductCategotyName | TotalRevenue | AvgUnitPrice |
|---|---|---|---|
| 1 | Bikes | 28318144.6507 | 1862.4231 |
| 2 | Accessories | 700759.96 | 19.4159 |
| 3 | Clothing | 339772.61 | 37.3335 |
SELECT pc.EnglishProductCategoryName,
SUM(fis.SalesAmount) AS TotalRevenue,
AVG(fis.UnitPrice) AS AvgUnitPrice
FROM [dbo].[FactInternetSales] fis
JOIN [dbo].[DimProduct] p ON fis.ProductKey = p.ProductKey
JOIN [dbo].[DimProductSubcategory] ps ON p.ProductSubcategoryKey = ps.ProductSubcategoryKey
JOIN [dbo].[DimProductCategory] pc ON ps.ProductCategoryKey = pc.ProductCategoryKey
GROUP BY pc.EnglishProductCategoryName
ORDER BY TotalRevenue DESC, AvgUnitPrice ASC;
Which product categories generate the highest sales revenue and how do their sales patterns compare over time?
Key Insights:
- Bikes dominate as the primary revenue driver, generating over 15 million in 2013 compared to under 700,000 for Accessories in the same peak year, indicating this business should prioritize bike inventory, marketing, and customer experience as its core profit center
- All three product categories experienced dramatic revenue spikes in 2013 followed by steep declines in 2014, suggesting either a one-time market event, successful promotional campaign, or potential data anomaly that requires investigation to understand whether this pattern can be replicated or avoided
- Accessories and Clothing show similar volatile patterns with extremely low baseline sales but occasional breakthrough years, presenting an opportunity to analyze what drove the 2013 success in these categories to develop more consistent growth strategies for non-bike products
| # | EnglishProductCategoryName | CalendarYear | TotalSalesRevenue |
|---|---|---|---|
| 1 | Accessories | 2012 | 2147.08 |
| 2 | Accessories | 2013 | 668241.53 |
| 3 | Accessories | 2014 | 30371.35 |
| 4 | Bikes | 2010 | 43421.0364 |
| 5 | Bikes | 2011 | 7075525.9291 |
| 6 | Bikes | 2012 | 5839695.3252 |
SELECT pc.EnglishProductCategoryName,
d.CalendarYear,
SUM(fis.SalesAmount) AS TotalSalesRevenue
FROM [dbo].[FactInternetSales] fis
JOIN [dbo].[DimProduct] p ON fis.ProductKey = p.ProductKey
JOIN [dbo].[DimProductSubcategory] ps ON p.ProductSubcategoryKey = ps.ProductSubcategoryKey
JOIN [dbo].[DimProductCategory] pc ON ps.ProductCategoryKey = pc.ProductCategoryKey
JOIN [dbo].[DimDate] d ON fis.OrderDateKey = d.DateKey
GROUP BY pc.EnglishProductCategoryName, d.CalendarYear
ORDER BY pc.EnglishProductCategoryName, d.CalendarYear;